AftabRad
Revit Add-in -> Doing Annual Temporal DGP (Daylight Glare Probability)
Analysis for the Selected Calculation Grid Point or Points
Here, this tutorial is about showing how to do a Temporal DGPs analysis (simplified DGP) for the selected grids of point or points.
Most of this tutorial is similar to what it said in the tutorial for Annual DGPs Analysis, but it will be different when importing the calculation data in the Data2Revit page.
To do so, at first, we need to define grids of points and their dominant view direction. The next step is to export the model and the selected grid points into Daysim.
Then, we need to do a DGPs analysis by Daysim and Finally import the results with the help of the Data2Revit page.
Therefore, to do a DGPs (Simplified version of Daylight Glare Probability) analysis for the selected grids points including a dominant view direction, we should do the following steps:
1-
Follow steps 1-9 in https://www.aftabsoft.net/AftabRadTutorial/annualDGP_PtsAnalysis.htm
to create an ill file that is based on the created surface grids with a
selected view direction.
2-
Now, it is time to import the calculation data into Revit. Therefore, the
next step is to press the importToRevit Button.

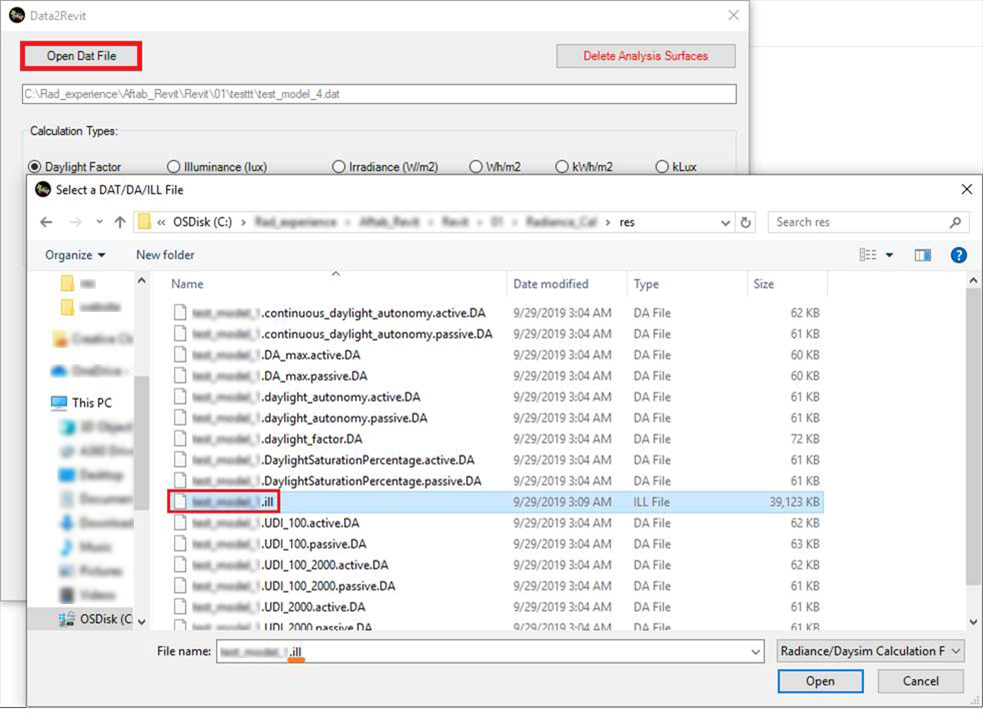
3- In the Data2Revit page, press the Open Dat File button to open an ill file.
The ill file usually is saved in the res folder under the where the Daysim hea file is saved.
4- Then as soon as opening the ill file, the ill2dat part of the page becomes enabled.
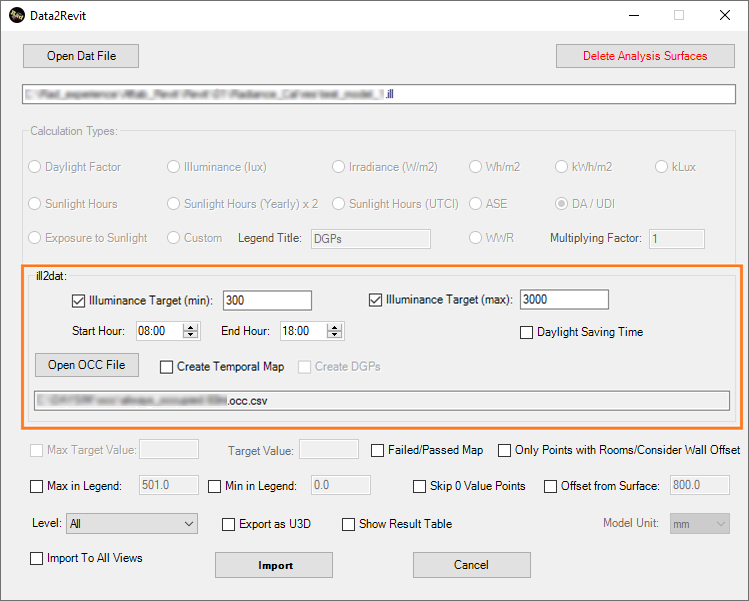
5- The next Is to activate the Create Temporal Map checkbox and press the Import button.
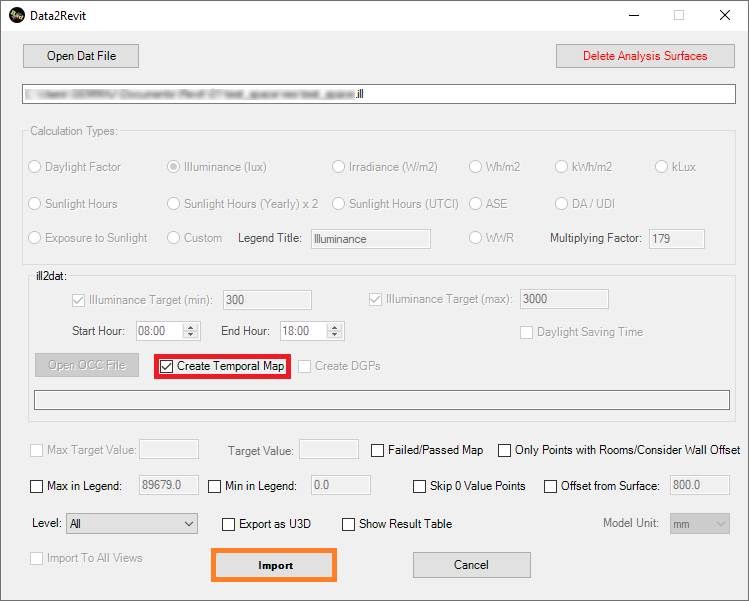
6- By pressing the Import button in the Data2Revit page, the Temporal Creation Form page will be opened.
Here in the below, you can find the description of different buttons, labels, textboxes, comboboxes, etc. in the Temporal Creation Form page.
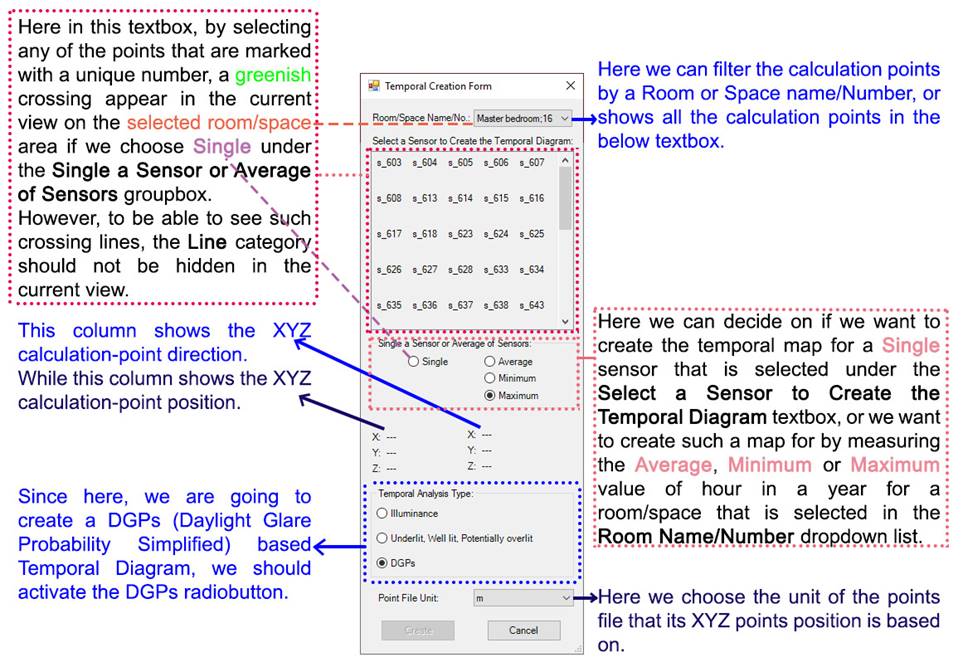
7- After selecting a single sensor value, or Average/minimum/Maximum of all the sensors value in the selected room, and defining the Temporal Analysis Type, and choosing the right unit for the Point file, by pressing the Create button the Temporal Map (Average/Minimum/Maximum based) Page will be opened.
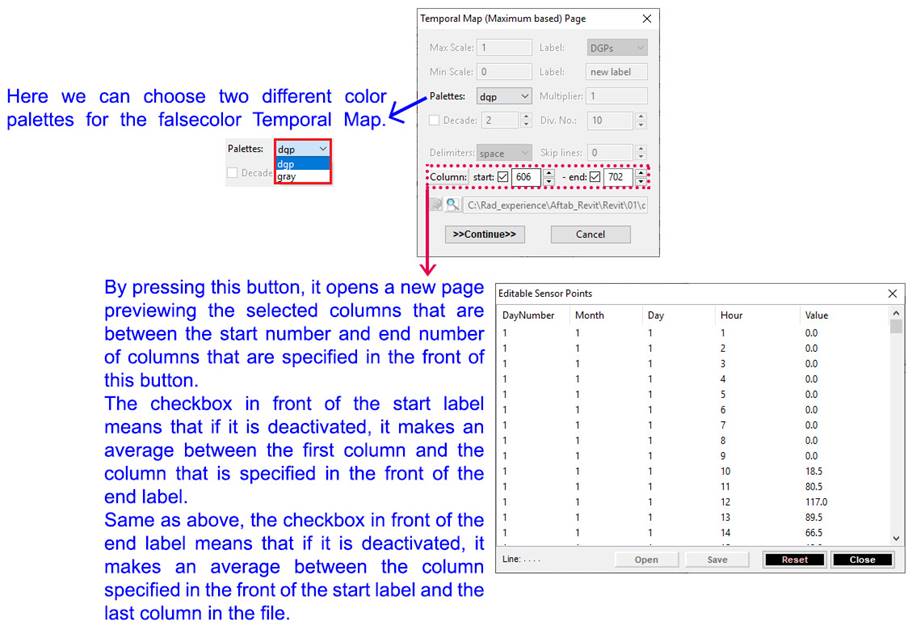
8- By adjusting all the parameters that are available in the Temporal Map (Average/Minimum/Maximum based) Page, and pressing the >>Continue>> button, the final Temporal Map for the selected analysis type will be created.
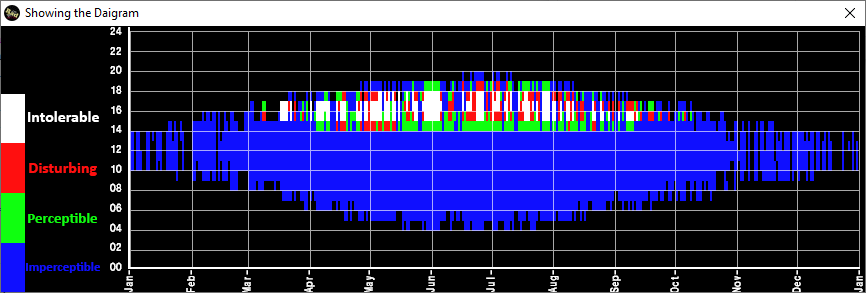
Here in the below, there are two examples for the dgp or gray options in the palettes combobox. In the dgp option, the temporal diagram is based on categorizing the values of each hour as Intolerable, Disturbing. Perceptible and Imperceptible. Such a categorization is based on the below table that comes from here.

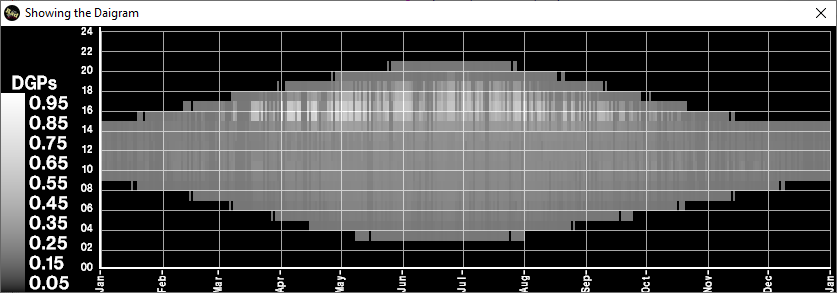
In case of choosing the gray option, the diagram scale is based on DGP values between 0.0 and 1.0.