AftabRad Revit Add-in -> Doing Annual DGP
(Daylight Glare Probability) Analysis on the Calculation Grid Points
Here, this tutorial is about showing how to do a DGPs analysis (simplified DGP) for grids of points.
To do so, at first, we need to define grids of points and their dominant
view direction. The next step is to export the model and the selected grid
points into Daysim.
Then, we need to do a DGPs analysis by Daysim and Finally import the
results with the help of the Data2Revit page.
Therefore,
to do a DGPs (Simplified version of Daylight Glare Probability) analysis for
the selected grids points including a dominant view direction, we should do the
following steps:
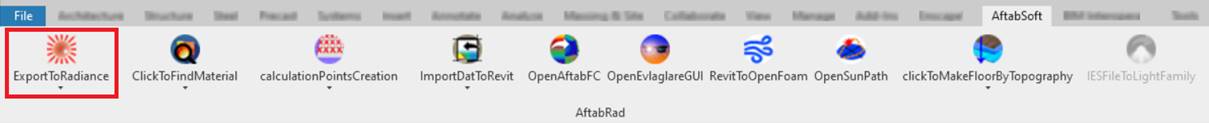
1- Press ExportToRadiance
button in the AftabRad Add-in

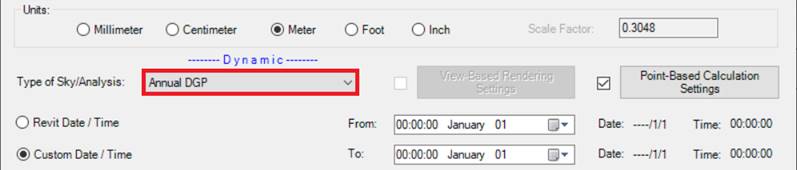
2- Select Annual
DGP in the Type of Sky/Analysis
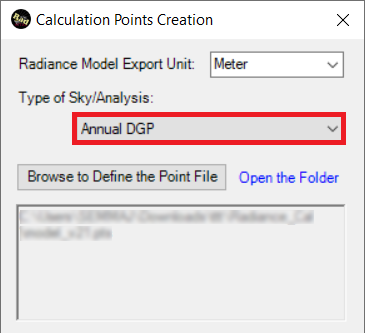
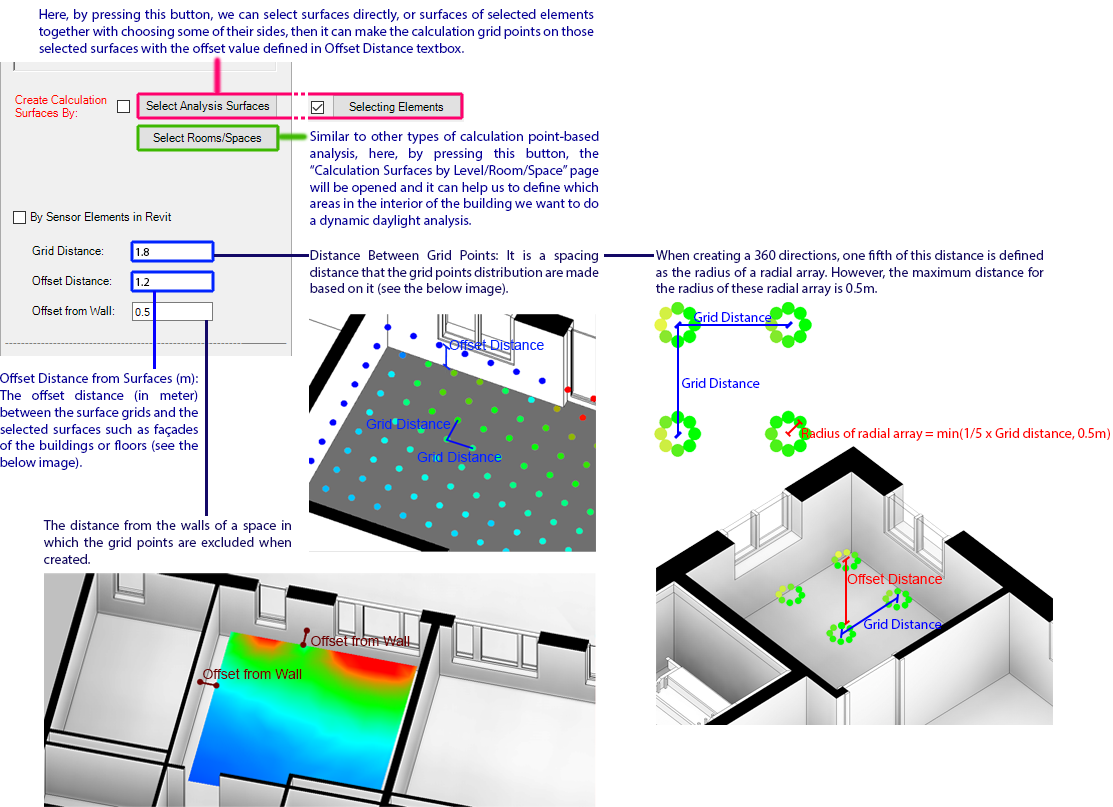
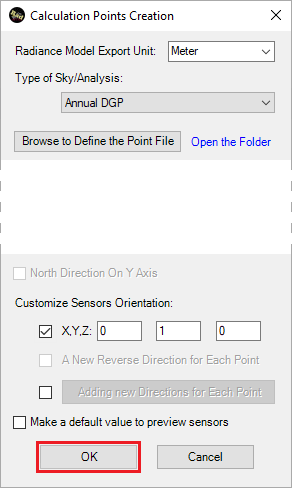
3- In the Calculation Point Creation page, we need to create calculation grids
points by selecting some surfaces in the model, some elements together with
choosing some of their surface normal directions,
or by choosing some of the rooms/spaces inside the
building to do the analysis.
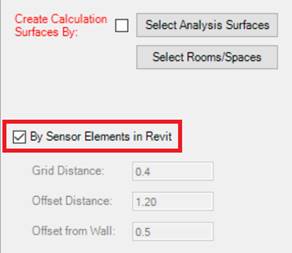
I.
As an another option, we can create a
calculation points file by using sensor grids points family instead.
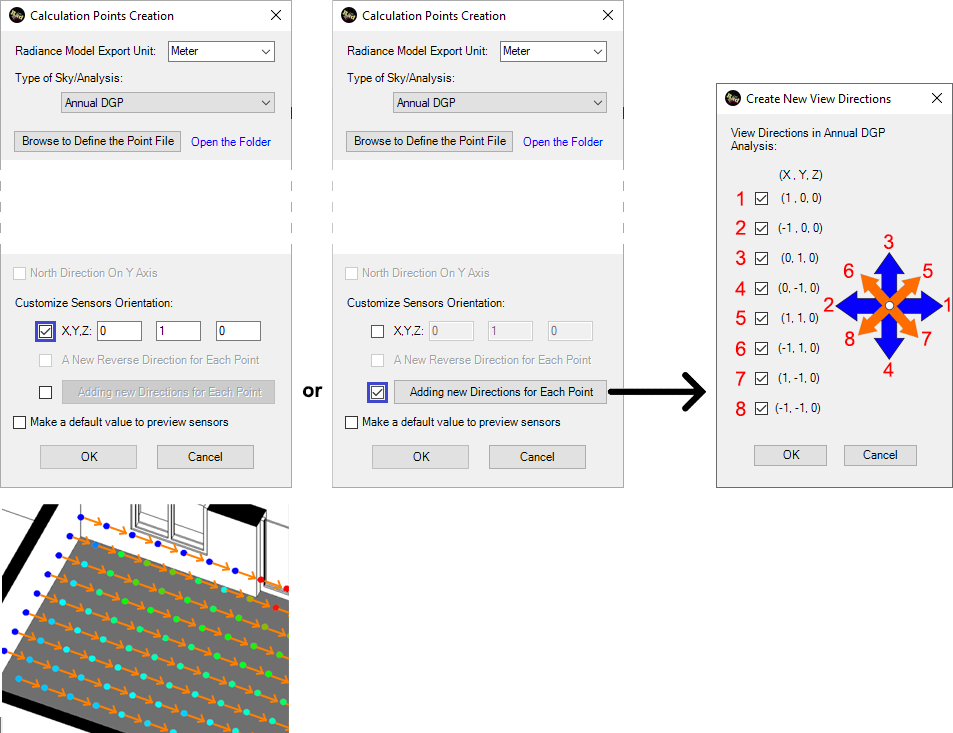
II.
Since any type of glare analysis is related to
the viewpoint and view direction, we can assign the view direction of the
calculation points by activating the checkboxes that are available under the Customize
Sensors Orientation.
To make only one view
direction for each calculation point, you can active the first checkbox that is
next to the X,Y,Z textboxes, but if you want to create more up to 8 directions (that
are based on the cardinal and ordinal direction )
for each calculation point, by activating
the checkbox next to the Adding new Directions for Each Point button and
pressing it, the Create New View Directions page will appear. In that
page, you can choose all or some of the cardinal and ordinal directions and
finally press the OK button.
4- In the next
step, we need to press ExportToRadiance button in the AftabRad Add-in
5- Check the checkbox next to the Rtrace Settings button, and then select Annual DGP in the Type
of Sky/Analysis
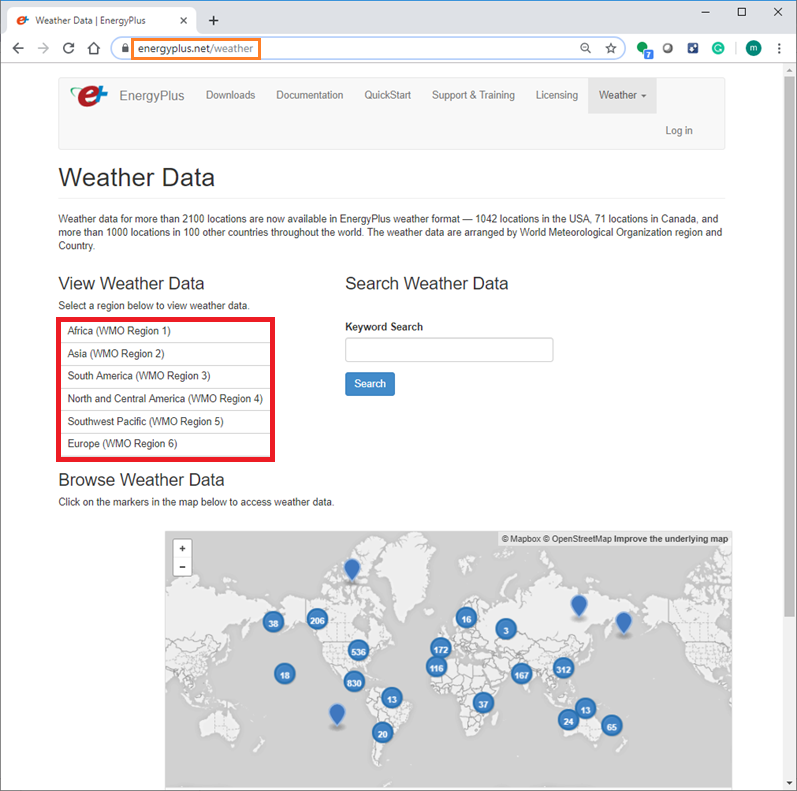
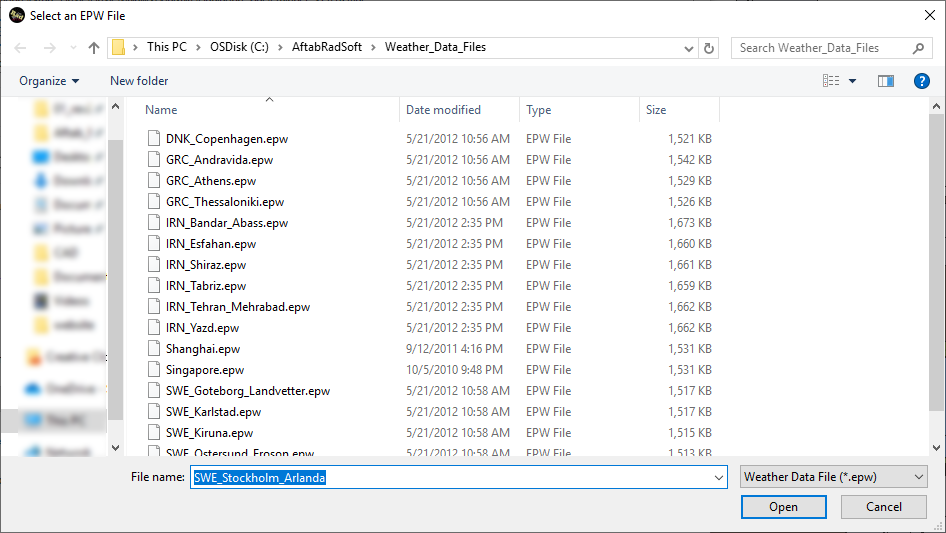
6- Since dynamic
analyses are usually based on including typical weather conditions of the place, we need to import EPW (Energy Plus
Weather Data File).
One of the most common way to find different EPW file for different
cities in the world is to download the weather data file of around 2000 cities
in the world from https://energyplus.net/weather
website.
The other free option to find an appropriate EPW file for your project
is to use this link: http://climate.onebuilding.org/
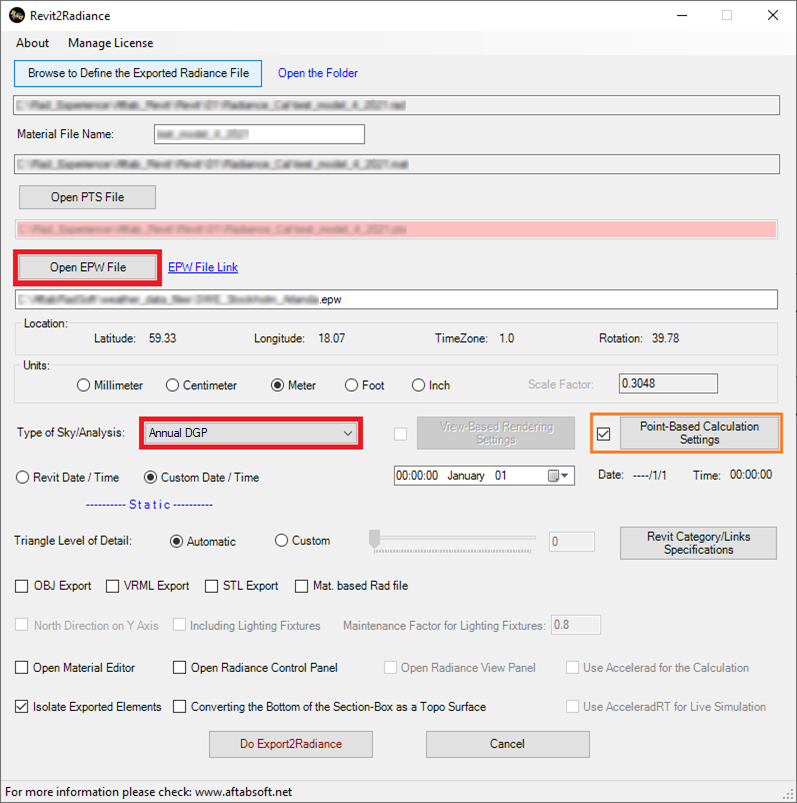
7- Press the Open
EPW File button and import an EPW file that is relevant for the location of
your model.
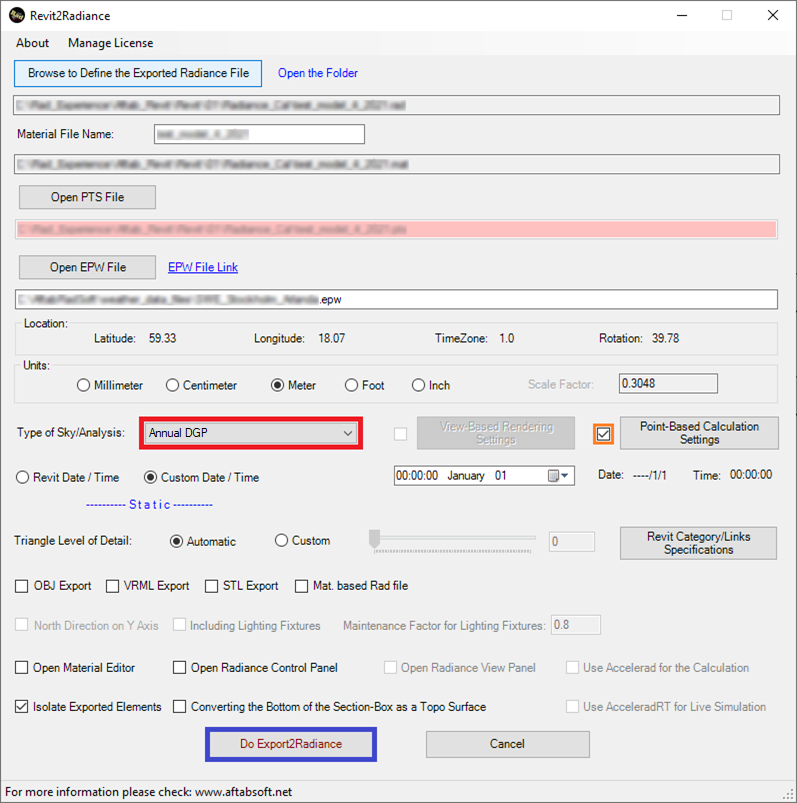
8- Check the checkbox next to the Rtrace Settings button, and press
the Do Export2Radiance button.
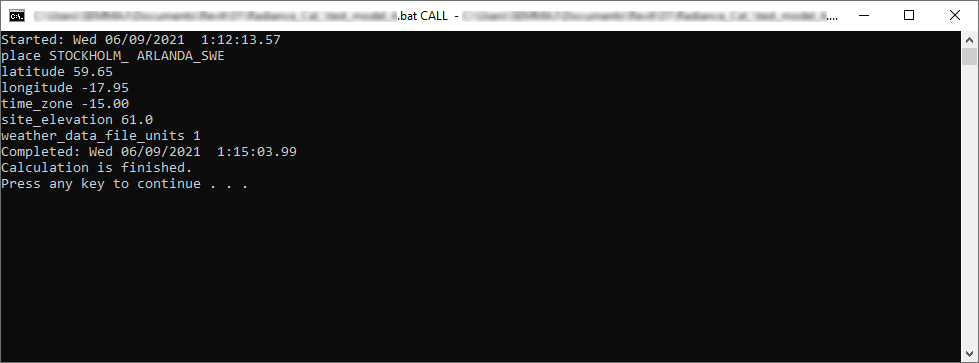
9- Next is to press the OK button in the rtrace Settings
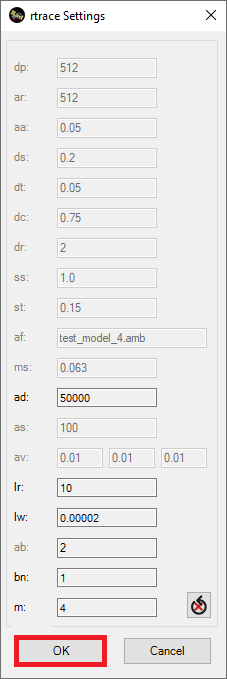
10- Then, you need to wait until the calculation is
finished.
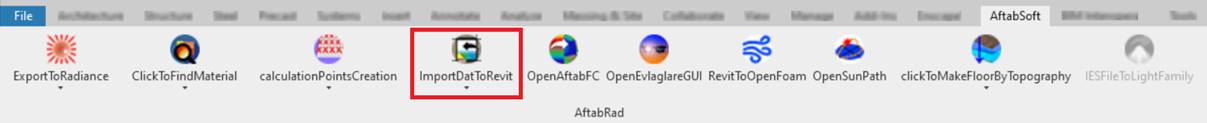
11- Now, it is time to import the calculation data into Revit. Therefore, the
next step is to press the importToRevit Button.
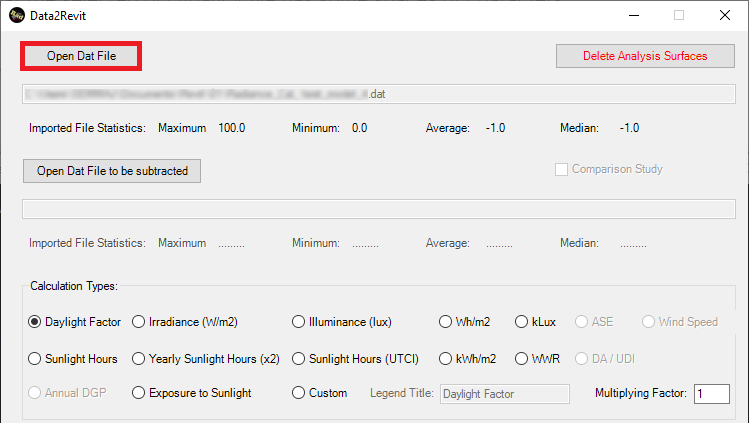
10 In the Data2Revit page, the Import button should be
disabled. Therefore, we need to press Open Dat File button to open the *.mtx
file.
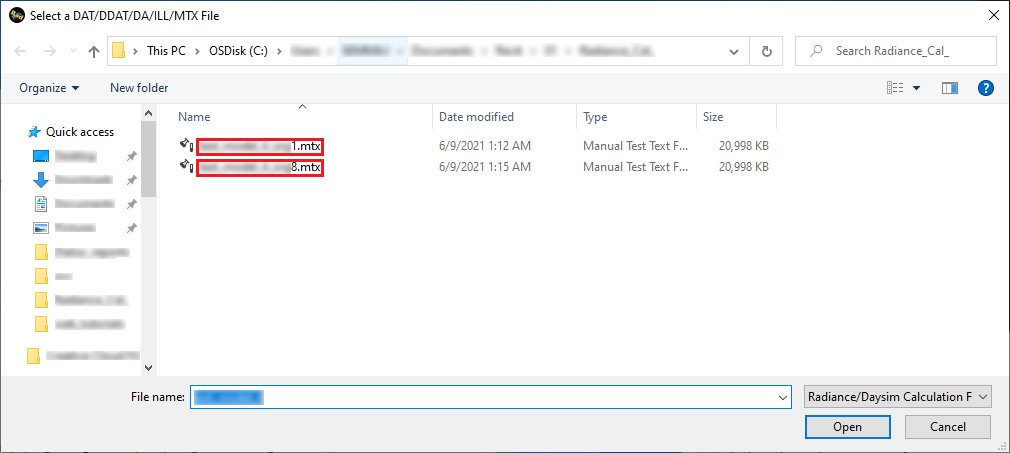
11- When pressing Open Dat File button, the below page will be opened.
If the calculation is done properly, we should see these two files (*1.mtx and
*8.mtx)
So, we can choose one of these two files and then press
the Open button.
11- Under the ill2dat panel, activate the Create DGPs checkbox
and then adjust the
bellow parameters:
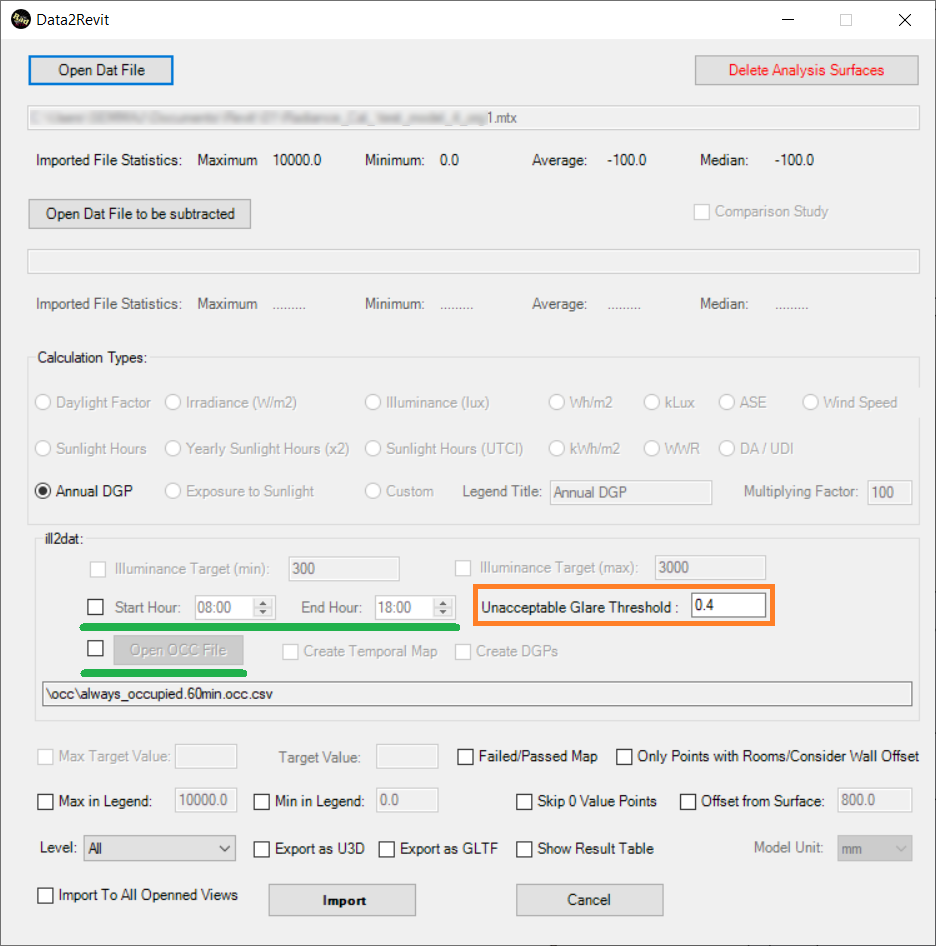
-
Unacceptable Glare Threshold:
Here in this textbox, all the calculated values that are
higher than this value are marked as a Potential Risk of Glare.
-
Start Hour:
By enabling the checkbox next to the Start Hour text,
we can define the starting time from which this DGPs calculation starts
for each selected day that is specified by the OCC file.
-
End Hour:
By enabling the checkbox next to the Start Hour text, we
can define the ending time until which this DGPs calculation ends for
each selected day that is specified by the OCC file.
-
Open OCC File:
By enabling the checkbox next to the Open OCC File
button, Here, by pressing this button, we can import a comma-separated hourly
occupancy together with the date and time range specifications.
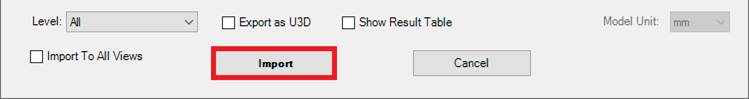
12- Finally, by pressing the Import button, we can import the Annual DGPs
analysis that shows the percentage of all annual working hours(based on and
whole year or what is extracted from the file under the Open OCC File
textbox) that are less than the Unacceptabe Glare Threshold for each
selected calculation point.
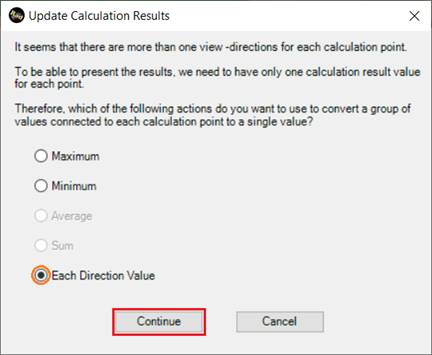
13- If there are more than 2 directions for each calculation point, then the Update
Calculation Results page will pop up on the screen.
a. If you choose the Minimum or Maximum radioboxes, after pressing the Continue button, the falsecolor calculation results
will be created base on the best (the Minimum radiobox) or worst (the Maximum radiobox) value for each calcuation point.
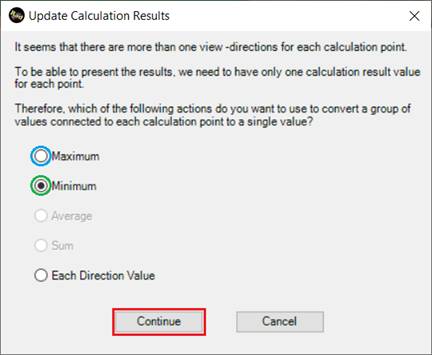
The results that will
be shown in Revit should be something like the below image.
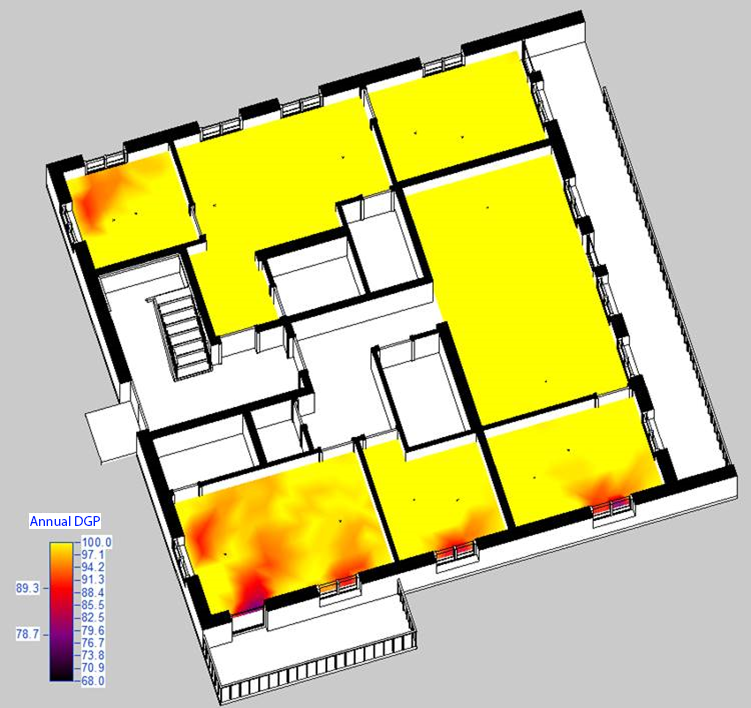
b. However, if you
want to see the results of each view direction for each calculation point, you
should choose the Each Direction Value radiobox and then press the Continue
button.
The results
being presented in Revit will be similar to the below image.
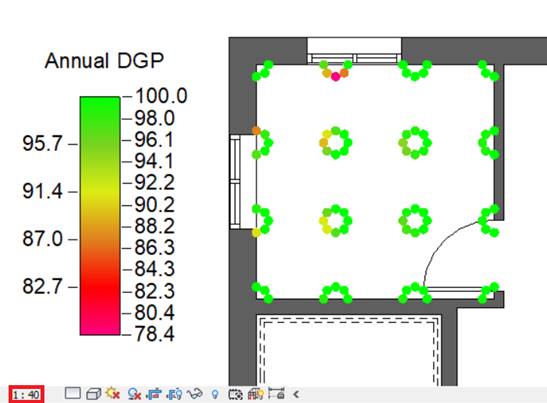
However,
to be able to see the filled circle results, you probably need to place with
the scale in the current view.