AftabRad
Revit Add-in -> Import To Revit: Create Room Results Report
This tutorial helps the users of this add-in to create a table summarizing the daylight condition of each selected room or space by finding some of the most common statistic measurements like the minimum, maximum, mean, median, etc for each selected room or space.
Since it is based on calculating a daylight metric on one or a few grids of sensors for the selected rooms or spaces, as a prerequisite it needs to already have finished such a daylight calculation by Radiance or Daysim. Thus, it needs a Radiance or Daysim calculation dat, da, or ill file to be able to create a statistic table out of it.
Therefore, to create a statistic table we should do the following steps.
1- Press ImportToRevit button in the AftabRad Add-in

2- In the Data2Revit page, press the Open Dat File button to open one of the finished dat, da, or ill files.
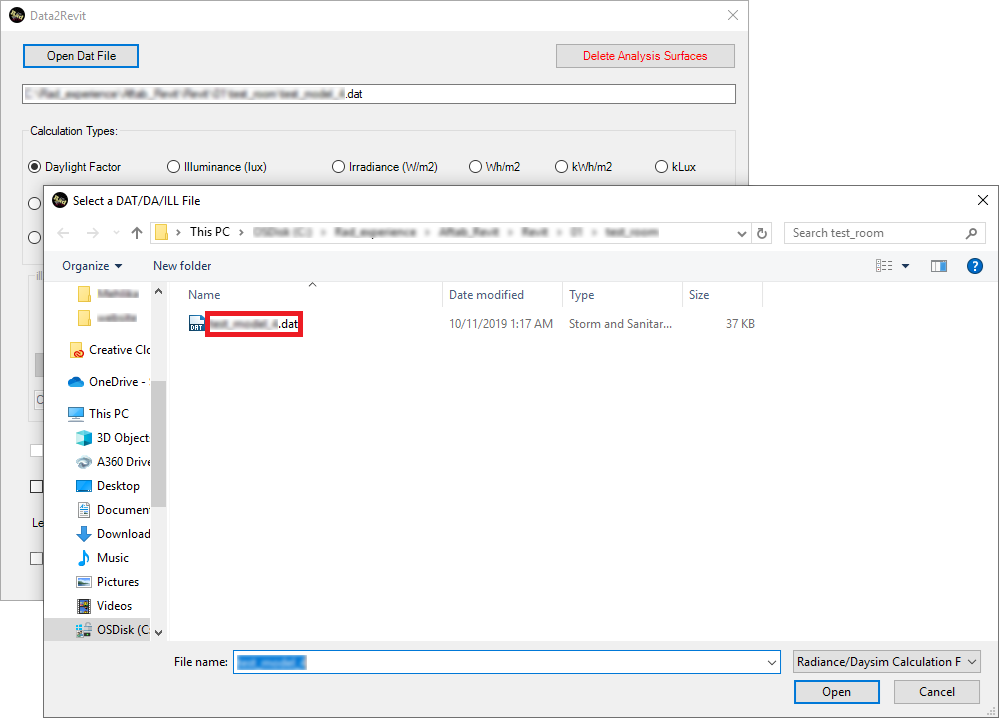
3- As soon as opening one of the dat, da, or ill file, the Import button in the Data2Revit page will be opened.
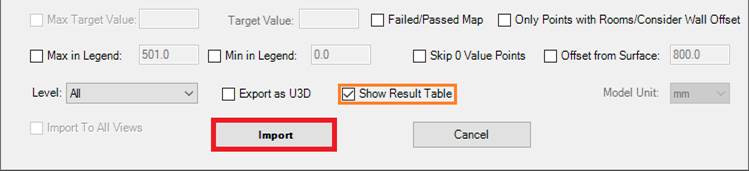
4- Then, to be able to open the Room Results Report page, you need to activate the Show Result Table checkbox.
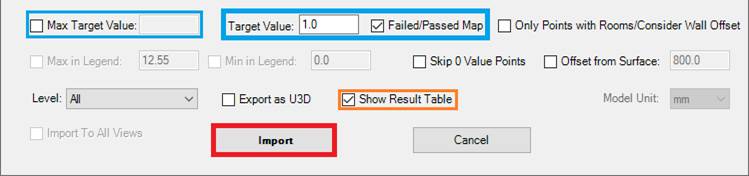
5- If you want to check the values of rooms against a value that is asked by a rule or certification, then you need to activate the Failed/Passed Map checkbox.
If you want to make the maximum and minimum limitation, then you need to activate the Max Target Value checkbox and add a new value to its front textbox.
6-
In
regards to skip to include the calculation sensor points that are in the border
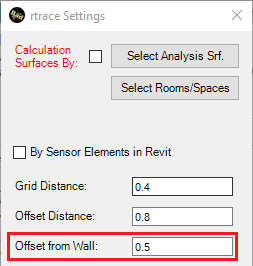
of the selected rooms, the rooms statistics calculation is not only independent from our choices for Only Points with Rooms/Consider Wall Offset
checkbox and Skip 0 value Points checkbox, but also always
exclude the calculation points in the Offset Distance (in the rtrace
Settings) from the walls.
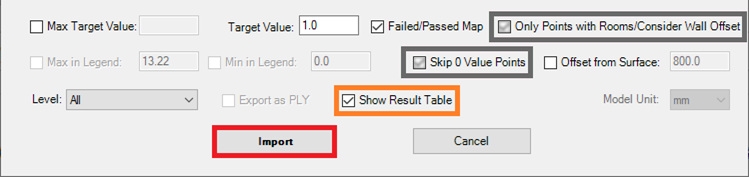
7- Then press Import to open the Room Results Report page.
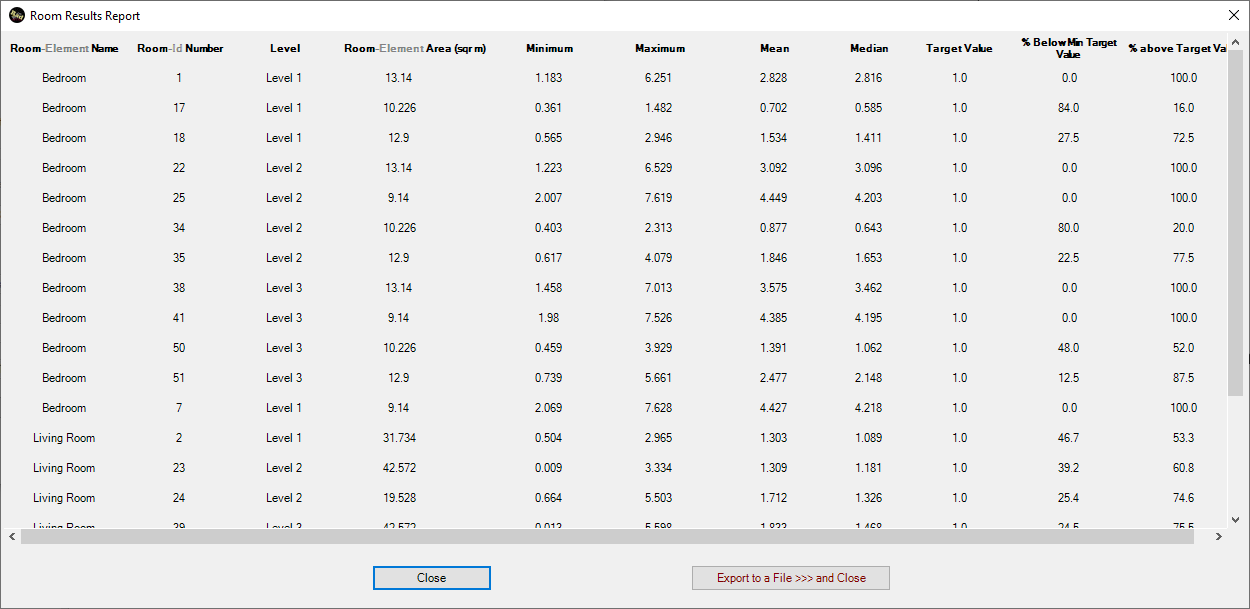
Here in the below, there are some explanations for each of the above columns title:
1- Room Name:
Here it shows the Revit room/space name.
2- Room Number:
Here it shows the Revit room/space number.
3- Level:
Here it shows the Revit level on which the selected room/space is placed.
4- Room Area (m2):
Here it shows the Revit room/space area in square meters.
5- Minimum:
In this column, we can find the minimum value that is calculated under that selected room/space.
6- Maximum:
In this column, we can find the maximum value that is calculated under that selected room/space.
7- Mean:
In this column, we can find the average value that is calculated under that selected room/space.
8- Median:
In this column, we can find the median value that is calculated under that selected room/space
9- Target Value:
Here it shows the target value that is usually asked by a rule or certification.
10- % below (Min) Target Value:
Here it shows the percentage of all values that are below the target value (or minimum target value) under the selected room/space.
11- % above (Max) Target Value:
Here it shows the percentage of all values that are above the maximum target value under the selected room/space.
-
Close button:
By pressing this
button, it closes the page and continues to import the results into Revit.
- Export to a File >>> and Close button:
By pressing this button, it exports and saves the extracted results in the table as a semicolon-based CSV file.